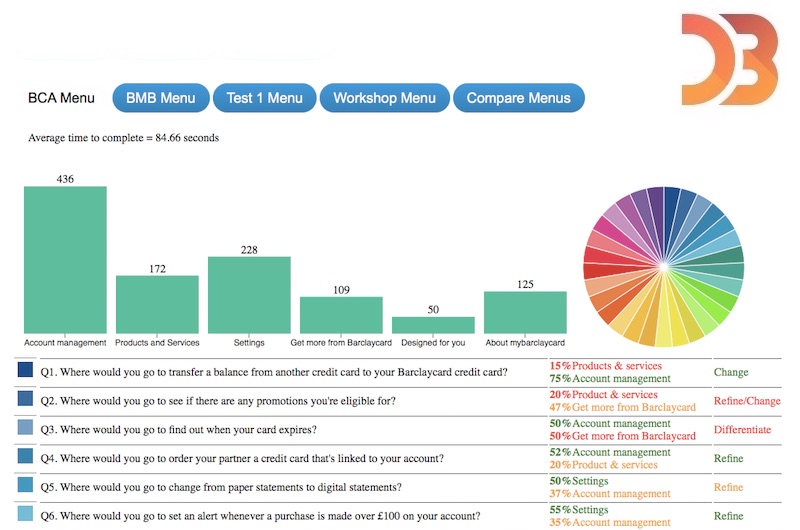
Barclaycard wanted to test 4 different Menus for its Barclaycard Mobile App. 4,800 participants were asked "Where would you go to XYZ?" and presented with one of four menus.
The large volumes of data could not be analysed in a spread sheet so I created a D3 interactive chart.
The chart is operated by mouse over and the bar charts and pie charts animate in realtime.
The chart's data is housed in a JSON object which can be accessed locally or shared on a server via AJAX.
Please ask for a demonstration of this interactive Single Page App.