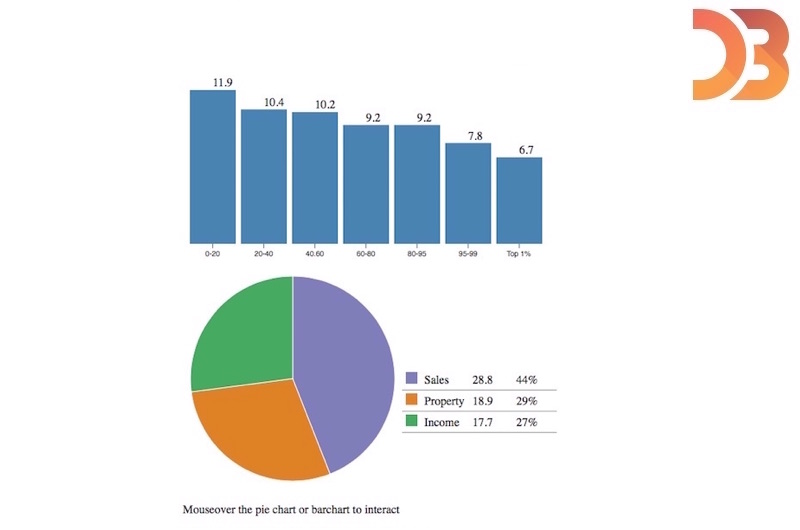
d3.js can be used to make a completely interactive chart with 2 graphs. The charts shows the average tax paid by different age groups in the UK.
Select the Live Demo link and click the pie chart or the bar chart
Live Demo